In general, data visualization technologies like Tableau and Power BI are similar. What then may be their differences? Of course, there are certain restrictions. For example, Power BI may be used to generate reports and forecast changes in the amount of data produced. However, a Tableau is utilized to provide far more in-depth visualizations.
The primary distinction is that Power BI, a business intelligence tool available from Microsoft since 2013, may be used for predictive modelling and data visualization. In the meantime, Tableau is a technology that has been around since 2003 and is mostly used to transform unprocessed data into stunning dashboards and provide original insights.
What’s Power BI?
Microsoft’s most recent data visualization tool, Power BI, was released in 2013. As a result, you can tell that the product is current when you mention 2013. With a variety of possible visualizations, it is a business intelligence tool for data visualization. It will create stunning dashboards for our data and transform the raw data into insightful analysis.
What’s Tableau?
Although it has been around since 2003, Tableau is now the most used data visualization tool. Additionally, this application assists us in transforming our raw data into insightful analyses and produces stunning dashboards for our data.
Major Differences
The following are the main variations:
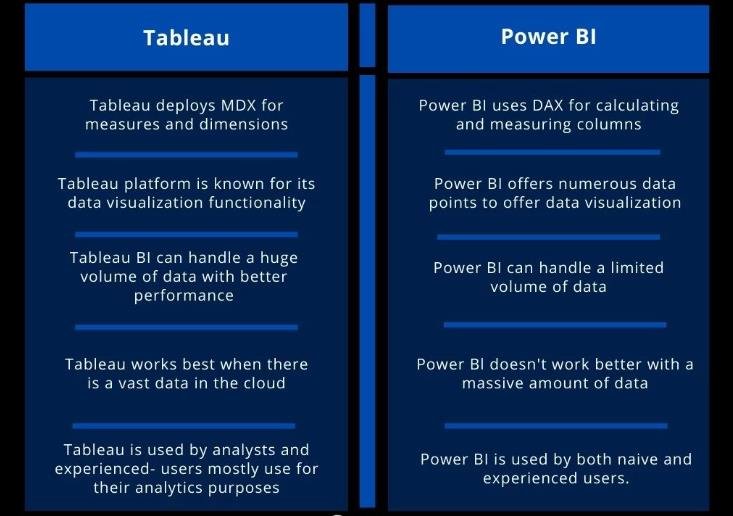
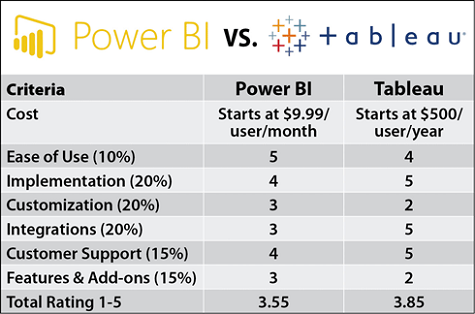
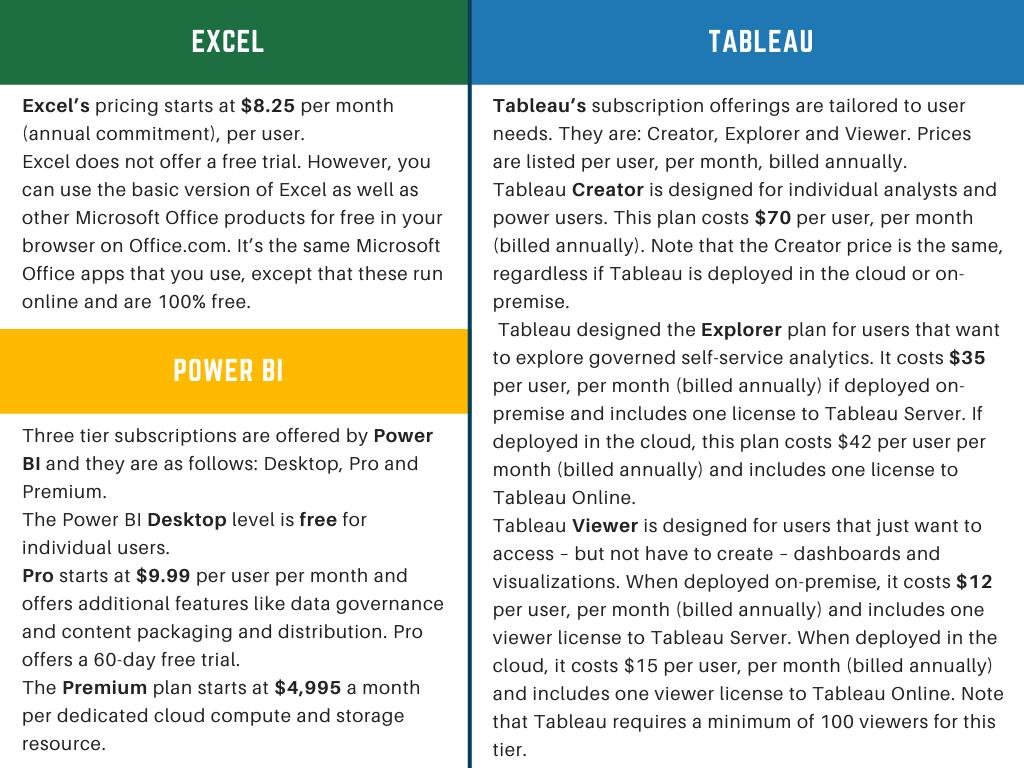
Cost: Tableau is an expensive product that you will need to spend a lot of money on, whereas Power BI is less costly.
Free Versions: Tableau’s free edition has very little access to all of the sophisticated features, whereas Power BI Desktop’s free version includes plenty of resources and tools to visualize the data.
Data Capacity: Azure and other cloud services are needed to manage data volumes larger than 10 GB, which Power BI is not capable of handling. Billions of data can be handled by Tableau without any issues or need for cloud services.
Comparative Table between Tableau and Power BI
| Items | Power BI | Tableau |
| Availability | It is an Office 365 version and is a Microsoft product. Enough tools are included in the free Power BI Desktop edition to create a dashboard. | It has existed for a very long period. The majority of those who analyze data are also familiar with this visualization tool. |
| Learning | Because Power BI is a Microsoft product, practically all of the DAX formulae we use in Excel are also there, and they appear to be quite simple to understand and use. | Tableau formulae are not used by many individuals. You could thus find it challenging to learn and use. |
| Cost to Acquire | Purchasing it doesn’t have to be expensive. The monthly cost is $10 for each user. The price of this tool is over ten times lower than that of Tableau. | A subscription to Tableau costs about $1,000 annually. |
| Data Sources | Excel, SQL, Azure, and other Microsoft products are all used by Power BI. | Additionally, Tableau is widely compatible and can retrieve data from any source. |
| Size of the Data | Up to 10 GB of data may be handled by each Power BI workspace; any more data must come from cloud-based services like Azure. | Tableau allows billions of rows to be stored by storing distinct values for every column. |
| User Interface | Power BI is simple to use and understand thanks to its user-friendly design. | The intelligent interface of Tableau enables the user to delve deeply and generate insights. |
| Integration | The majority of Power BI’s straightforward integration sources are third-party data sources. | While Power BI and Tableau have similar features, Tableau is superior in this regard as it can combine data right out of the box. |
| Visualization | Its data uploading process is simple, and its visualization options much outperform those of Tableau. | Tableau has far superior drill-down capabilities, is capable of handling massive amounts of data, and lets users quickly move between visualizations. |
| Customer Community | Although it is a more recent product and has a smaller user base than Tableau, it will soon overtake it. | Tableau has a sizable customer base and has been around for a while. |
| Deployment | Software as a service, or SaaS, is the model that Power BI employs. | Tableau is offered as cloud-based and software. |
Advanced Functionalities and Features
Although data visualization is an area in which Power BI and Tableau both shine, their advanced features highlight subtle distinctions. On the other hand, Tableau excels in producing complex visualizations that allow for a more in-depth and imaginative investigation of datasets. Using Power BI forecasting, users may create reports and forecast data patterns with Power BI’s predictive modelling features. The degree of knowledge each tool provides, meeting various analytical objectives, is what makes them distinct from one another.
Data Processing Capabilities
A comparison of Tableau and Power BI’s data processing capabilities reveals differences in scalability. On the other hand, Tableau shows its mastery in handling large datasets without the urgent requirement for cloud services by claiming to be able to manage billions of data points with ease. Since Power BI can only handle 10 GB of data, bigger datasets will need to be stored on cloud services.
Development and Historical Background
Comprehending the historical background of these instruments illuminates their development. Conversely, Tableau has been a mainstay in the field since 2003, becoming the de facto visualization tool in the process. A more recent addition to the data visualization space is Power BI, a Microsoft tool that has been around since 2013. When it comes to current development status, it is recommended to check through Acterys official website and assess the Power BI professional and corporate services. Acterys has solutions to almost everything related to Power BI.
Comprehensive Analysis of the Power BI Comparative Table
Subtleties in user interface, data sources, learning curves, and integration are shown by extending the comparison table. For others, though, Tableau’s special formulae may mean a more challenging learning curve. Although both products can work with a variety of data sources, Tableau has an advantage over Power BI in terms of smooth data connectivity because of its built-in integration features. Because of its Microsoft heritage, Power BI is more familiar and has an easier learning curve with DAX formulae that resemble Excel.


